An operating system for
Mid-market CFOs · PE operating partners · portfolio company CEOs · mid-market CEOs & owner-operators · portfolio company CFOs · mid-market COOs · portfolio company COOs · fractional CFOs · fractional COOs · independent sponsors · search fund operators · interim CEOs, CFOs & COOs · turnaround & restructuring leads · boutique consulting firm partners · PE operating-group & portfolio-ops leads · fractional Chief AI Officers · independent management consultants · boutique AI consultancy founders · heads of transformation · VPs & directors of operations · heads of finance & VPs of finance · heads of AI & AI strategy · chief strategy officers · directors of innovation · family office operating partners · family office direct investors · M&A / post-merger integration leads · corporate development directors · quality-of-earnings providers · digital transformation consultants · process-excellence & Lean Six Sigma leads · independent board directors & advisors · CIOs · CTOs · CDOs · chief data officers · chief risk officers · chief compliance officers · internal audit & AI-risk leads · mid-market investment bankers · growth-equity investors · venture capital operating partners · healthcare system COOs · healthcare CFOs · manufacturing VPs of operations · B2B SaaS COOs · distribution & logistics operations directors · professional-services operations leads · insurance & banking operations directors · and PMO directors driving EBITDA growth and agentic-AI value creation.
Strategic EBITDA Acceleration System

Target hidden profit in your $50M–$500M business through the SEAS agentic-AI implementation system, and unlock EBITDA expansion. Discover. Prioritize. Execute. Compound. You wait — and inefficiencies grow, value remains uncaptured, and your competitors widen their advantage.

Recover a modeled $5.3M in annual EBITDA on a $150M-revenue company.

SEAS is the complete agentic-AI implementation system for mid-market operators in the $50M–$500M range — the CFOs, COOs, CEOs, and transformation leads who have to turn AI into margin — plus the consultants, fractional executives, and advisors who deliver it for them (and the PE firms that back them). 35 purpose-built AI agents. 6 structured phases. One outcome: turn AI from a line item into measurable EBITDA. This leak compounds every quarter you wait.

Get SEAS Now → Free FLOAT Diagnostic
Instant download · One-time payment · FLOAT is free, no email required
By clicking Get SEAS Now you agree to our Terms & Conditions.
Not ready to buy? See where to start — a 2-minute fit check, the free book, or your instant number ↓
100% refund within 90 days
Independently reviewed by practitioners · Thomson Reuters & ex-PE (REA Group)
Built to deliver what $100K–$500K engagements produce
35
AI Agents
6
Operating Phases
13
Industry Verticals
$12M
Modeled annual EBITDA leakage in the $150M reference company
$5.3M
Modeled annual recovery target using the SEAS playbook
2.10×
Modeled MOIC vs 1.48× baseline (SEAS scenario, 9.5× re-rated exit)
+3.6 pts
EBITDA margin expansion (12% → 15.6%)
Where to start

From curious to captured, in six steps

Most people move through these in order — but it's flexible. Many run FLOAT before the fit check, or jump straight to ARED for the number. Start wherever fits.

1
Fit check
SEAS fit assessment
2 minutes · free
Answer a few questions to see whether SEAS fits your company — and which path suits you.
Take the assessment →
2
FLOAT
Firm Leakage Opportunity And Triage
the book · free
The 90-minute diagnostic, explained. Run the three-pocket method yourself — or skip ahead if you'd rather not.
Get FLOAT free →
3
ARED
Automated Rapid EBITDA Diagnostics
automated
Don't want to do it by hand? Enter your figures and get your three-pocket number as a board-ready PDF in 60 seconds.
Run ARED →
4
DVD
Detailed Validated Diagnostics
validated
Validate your number against your real financials and return a board-ready PDF you can take to an IC.
AI Disclosure: The assessment of your firm's scenario and all deliverables may be prepared in whole or in part — up to 100% — using AI tools. No specific outcome is guaranteed.
See DVD →
5
DIR
Diagnostics and Implementation Roadmap
+ roadmap
Everything in DVD, plus a populated financial model and a phased roadmap mapped to the SEAS six phases.
AI Disclosure: The assessment of your firm's scenario and all deliverables may be prepared in whole or in part — up to 100% — using AI tools. No specific outcome is guaranteed.
See DIR →
6
SEAS
Strategic EBITDA Acceleration System
the full system
The complete implementation system — 35 AI agents, six phases, financial models, and legal templates to capture the EBITDA yourself, at one company or across a portfolio.
Get SEAS →

See how SEAS turns the playbook into execution.

A short walkthrough of the system. Nothing loads until you press play — so it adds no weight to the page.

Play the SEAS walkthrough video
Privacy-enhanced playback · loads on click only

Everyone knows AI matters. Almost no one was told how to implement it.

Whether you run a mid-market company, sit on a PE operating team, or advise both as a consultant, the pressure is identical: expand EBITDA margins, move faster, and prove that AI spend turns into measurable results — not just activity.

AI is no longer optional. But the gap between "we should use AI" and "AI is generating measurable EBITDA recovery" is costing real quarters of value-creation time.

The $100K–$500K consulting engagement helps. But it takes months, demands internal bandwidth you don't have, and walks out the door when the project ends.

SEAS is the self-serve alternative: a complete implementation system you and your team can deploy in weeks, not quarters — at a single company, or across an entire portfolio under portfolio licensing.

Leakage Category Identified / yr
Supply chain & vendor spend$6.0M
Administrative & SG&A processes$4.0M
Energy & operational overhead$2.0M
Total Identified Leakage $12.0M

FLOAT = Firm Leakage Opportunity And Triage. Recoverable subset: $2.5M + $1.8M + $1.0M = $5.3M annually — the conservative figure, not the headline. Diagnostic methodology included with SEAS.

Six phases. 35 agents. A complete operating architecture.

SEAS is not a framework. It's a deployable system — a sequenced set of AI agents, templates, runbooks, and financial models that map to every phase of value creation, whether you're running a single mid-market company or driving results across a PE portfolio.

Phase 01
FLOAT Diagnostic
Surface and quantify the leakage: where your EBITDA is escaping and exactly how much. Structured triage across 6 functional categories.
Phase 02
Agent Deployment
Deploy the 35-agent library (9 cross-functional + 26 industry-specific) to the highest-ROI workflows first. Prioritized by leakage severity.
Phase 03
Quick Wins Sprint
90-day pilot playbook for immediate EBITDA recovery. Finance automation, procurement triage, and revenue attribution — the fast money.
Phase 04
System Integration
ERP data export, vendor landscape mapping, and ERP/CRM integration guides. AI that connects to your actual operating stack — not a sandbox.
Phase 05
Governance & Compliance
NIST AI RMF, SOX, GDPR, CCPA/CPRA, and EU AI Act compliance deep-dive. LP-ready governance documentation and audit trail.
Phase 06
Exit Preparation
IC Memo, LP Quarterly Update, Portco CEO Briefing, and Fund-Level AI Scorecard — the evidence package for maximum exit multiple.

Built for the operators doing the work. A wide circle around them.

SEAS was built first for the mid-market operators who own EBITDA and have to make agentic AI actually produce margin. But the same agents, models, and runbooks serve everyone who implements, advises on, audits, teaches, or invests around AI in that world — including the private equity firms that back these companies. Find yourself below.

Primary
Mid-Market Operators
CEOs, CFOs, and COOs at $50M–$500M companies who own EBITDA and need AI to produce margin, not noise.
Primary
Owner-Operators & Family Businesses
Founder-led and family-owned $50M–$500M companies with no PE sponsor and no consulting budget — capturing the same EBITDA with their own team.
Primary
Transformation & AI Leads
Heads of transformation, strategy, AI, digital, and data who were handed the AI mandate and need a complete, ready-to-run playbook.
Operator
Functional VPs & Directors
Leaders of operations, finance, supply chain, customer, sales, marketing, HR, engineering, and the PMO putting agents to work in their function.
Operator
Heads of FP&A & Controllers
The finance leaders who own the baseline — running the leakage diagnostic on data they already close every month, and defending the recovered number to the board.
Operator
CIOs, CTOs & CISOs
Technology leaders owning agent architecture, build-vs-buy, vendor selection, and security for AI deployment.
Operator
AI Engineers & Technical Teams
AI/ML engineers, data scientists, solution architects, and customer-success leads who build and deploy agents — plus IT directors evaluating vendors — needing the business framework, reference architecture, and ROI language around the work.
Advisor
Management Consultants
Independent consultants and boutique firms who deploy SEAS as a ready-built methodology with their own clients.
Advisor
Fractional CFOs & COOs
Fractional and interim executives serving several companies at once, reusing one rigorous system across every engagement.
Advisor
Big-4 & Strategy Consultants
Associates and managers at Bain, BCG, McKinsey, Deloitte, EY, PwC, KPMG, and Accenture upskilling beyond firm IP.
Advisor
AI Consultancies & Fractional CAIOs
Solo and boutique AI-implementation practices white-labeling the framework, templates, and prompt library with clients.
Advisor
Turnaround, PMI & Six Sigma Leads
Restructuring, post-merger integration, digital-transformation, and process-excellence specialists adding an AI layer.
Investment
PE Operating Partners
Operating partners and portfolio-company leaders standardizing AI value creation across the portfolio, diligence to exit.
Investment
Search Funds & Independent Sponsors
Solo acquirers and sponsors running a company without an institutional bench behind them.
Investment
Family Offices & M&A Teams
Direct investors, corporate development, and integration teams driving operational value across holdings and post-close.
Investment
VC, Growth Equity & Bankers
Venture, corporate-VC, and growth operating partners, plus sell- and buy-side bankers and quality-of-earnings teams assessing AI maturity.
Vertical
Industry Specialists
Operators in healthcare, manufacturing, retail & e-commerce, logistics, construction, SaaS, hospitality, insurance, banking, professional services, real estate, education, and the public & non-profit sectors using vertical-specific agents.
Risk
Risk, Compliance & Audit
CROs, CCOs, and internal auditors mapping AI programs to NIST AI RMF, ISO 42001, SOC 2, GDPR, and the EU AI Act.
Risk
Legal, Procurement & Underwriters
AI counsel, procurement leads, cyber/E&O underwriters, lenders, and analysts who must form independent judgments on AI deployments.
Builder
Operators in Transition
Professionals moving between industry, consulting, and fractional practice who need an operator-grade framework from day one.
Global
International Operators
Mid-market leaders across India, Southeast Asia, the Middle East, Latin America, Africa, Europe, ANZ, and Canada — regional pricing on request.
Institutional
Educators & L&D
Business schools, executive-education programs, corporate learning teams, and certification bodies — licensing inquiries by email.
Advisor
Board Directors & Advisors
Independent directors and board advisors at mid-market and PE-backed companies who need a diligence-grade framework for AI oversight and governance.
Vertical
Public Sector & GovTech
State, municipal, and federal transformation and procurement leads bringing agentic AI into the public sector with a governed, procurement-friendly approach.

Not sure it fits? The 2-minute fit assessment will tell you honestly — including when the answer is no. Or start free with the FLOAT Diagnostic.

Have a question before you buy? Ask the person who built it.

SEAS isn't right for everyone. If you're weighing whether it maps to your business, your role, or your existing stack, email the question before you commit a dollar — and get a direct, specific answer from the practitioner who built the framework, not a sales script or a bot. Write to [email protected] with your company size, your role, and the problem you're trying to solve. You'll get an honest read — including whether it isn't the right tool for you.

Everything your team needs to execute.

SEAS ships as a complete companion suite — not a single playbook. Every deliverable is ready for immediate deployment by your team, your client, or your portfolio company's management.

  • SEAS Master Playbook
    The core 6-phase implementation guide with Go/No-Go gates, financial model integration, and operator runbooks.
  • RAPID SEAS Playbook
    Daily execution manual for operating partners with constrained bandwidth — 12-Week Toolkit with FLOAT diagnostic, Go/No-Go checklists, ROI calculator, and board deck template.
  • 35-Agent Prompt Library
    9 cross-functional agents + 26 industry-specific agents across 13 verticals. Audited for internal consistency — build-ready specifications with production prompts.
  • Working Financial Model
    Excel model with full EBITDA bridge, leakage quantification, MOIC uplift calculator, and 3-year hold analysis.
  • EBITDA PathFinder Pro v3.0 (Software)
    Interactive diagnostic app across 7 modules. Enter your financials and it benchmarks you against 8 industry libraries, generates up to 11 costed optimization paths — each with implementation cost, payback period, and a realizability score — then models any combination in the Scenario Builder and runs full MOIC/IRR value creation with your entry and exit assumptions. Runs in any browser on Macintosh, PC, or any operating system — fully offline. No install, no login — your financial data never leaves your machine.
  • Templates Library
    IC Memo, LP Quarterly Update, Portco CEO Briefing, Fund-Level AI Scorecard, Vendor RFP Template — board-ready.
  • Project Manager's Runbook
    Week-by-week Gantt, 29-milestone tracking, stakeholder alignment guides, and change management protocols.
  • Governance Deep-Dive (Appendix N)
    Primary-source verified compliance across NIST AI RMF, SOX, GDPR, CCPA/CPRA, EU AI Act, and PCI DSS v4.0.1.
  • 90-Day Pilot Playbook
    Structured quick-win sprint: agent deployment tracker, ERP data export guide, vendor landscape matrix, and ROI measurement framework.
  • FLOAT Diagnostic System
    The triage methodology that surfaces 3+ quantifiable EBITDA pockets in 90 minutes of executive time, inside a 7-day sprint. Included in RAPID SEAS and the SEAS Playbook.

$48M–$120M in modeled EV uplift. $500K+ alternative cost.

A single SEAS workflow implementation — properly deployed — recovers enough EBITDA to generate a measurable MOIC uplift. The math is not complicated.

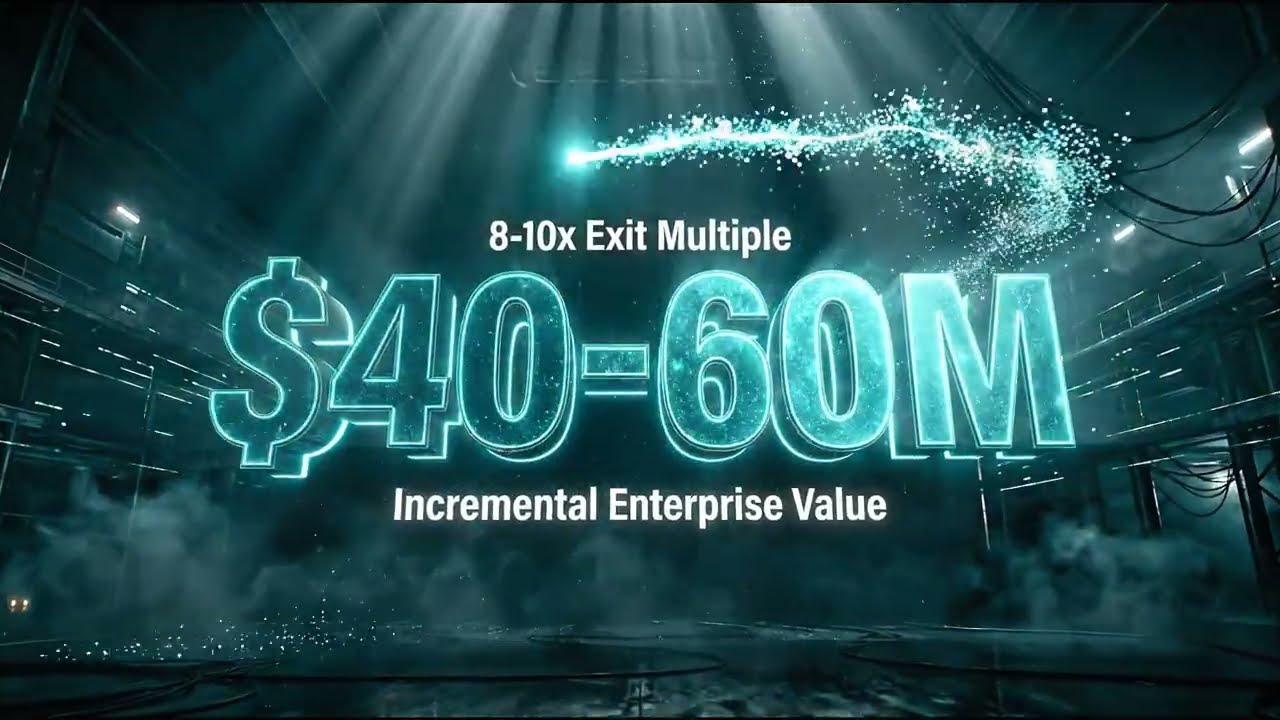
At an $18M EBITDA base (12% margin on $150M revenue), recovering the modeled $5.3M lifts exit EBITDA to roughly $24M. At a constant 8× exit multiple — no re-rating assumed — that's +$48M of enterprise value. The AI-native re-rating scenarios (10×–11×, with the capability documented in the data room) lift the bridge to +$96M and +$120M.

In the verified MOIC model — entry at 8.0×, 4.0× leverage, three-year hold, exit net debt deducted, AI uplift underwritten at the bankable 9–15% of baseline EBITDA — the deal moves from a 1.48× baseline (13.9% IRR) to a modeled 2.10× (28.1%) in the SEAS scenario at a 9.5× exit, and 2.55× (36.7%) in the full-execution scenario at 10.5×; the exit multiples reflect the modeled buyer premium for demonstrated AI-native operations. Held at a constant 8.0× with no re-rating, the same scenarios still model 1.66× and 1.78×. Every figure is a live formula in the MOIC Calculator workbook.

Even a partial implementation — capturing only a fraction of the modeled upside — creates enterprise value many multiples beyond the one-time cost of the system.

Illustrative Value Model — $150M Portco
Portco Revenue$150M
Base EBITDA$18M (12%)
Enterprise Value @ 8×$144M
Identified leakage$12.0M / yr
Annual recovery target$5.3M
EBITDA margin uplift+3.6 pts
EV uplift @ constant 8× exit+$48M
AI-native scenario @ 10×+$96M
High-performer scenario @ 11×+$120M
MOIC, baseline → +SEAS1.48× → 2.10×
vs. consulting alternative$100K – $500K
Modeled EV Uplift +$48M to +$120M

Vetted by practitioners before it shipped.

Before release, SEAS was put in front of senior people in private equity and enterprise technology for independent review — not as customers, but as practitioners asked to pressure-test the logic, the models, and the claims. They reviewed it; they were not paid to endorse it. Employers are named for identification only and have not reviewed or endorsed SEAS.

Most AI initiatives I see stall in production — they demo well and never touch the P&L. This is the rare one built to survive contact with a real enterprise: defined inputs, real guardrails, human checkpoints, a rollout that can’t outrun its own gate. It doesn’t just name the problem; it gives a governed path to fix it. This is how I’d architect it for a client, not a pitch deck.
Abhishek Behera
Senior Tech Lead, Thomson Reuters · reviewed SEAS prior to release · LinkedIn
Independent peer review
I rarely see frameworks that combine rigor, practicality, and auditability this well. I went looking for holes in the MOIC math and didn’t find them — the bridge from EBITDA recovery to exit multiple is logic I’d defend in an IC. What’s rare is the discipline: every number is a modeled range tied to a mechanism, not a vague transformation promise. Most operators are still guessing at where the value is; this tells you, and shows its work.
Garvit Bhada
Former PE Analyst, REA Group · now in US financial services · LinkedIn
Independent peer review

Reviewers assessed SEAS before release and consented to be cited as independent reviewers. They are not customers and reviewed the framework rather than deploying it.

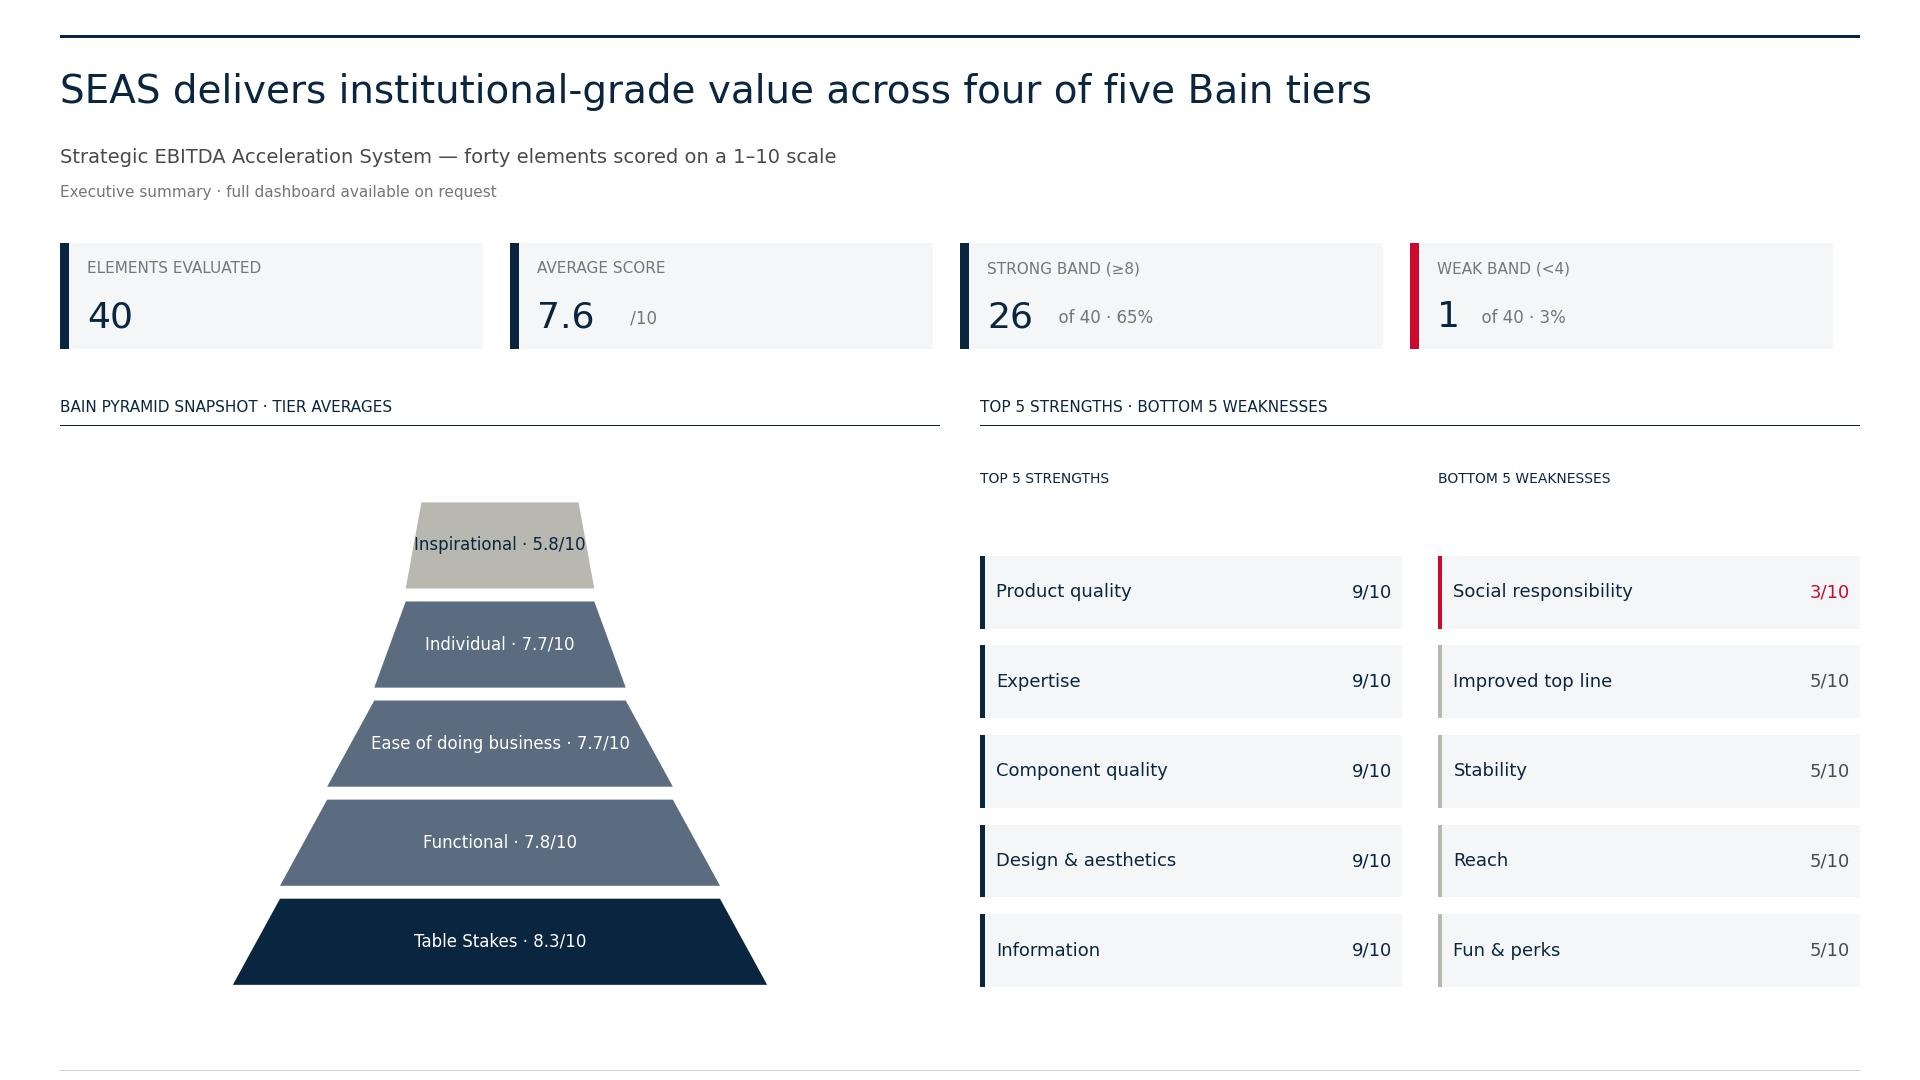
7.6 / 10 across 40 institutional value elements.

We scored SEAS ourselves against Bain & Company's B2B Elements of Value framework — a structured self-assessment, not a Bain engagement or endorsement. Twenty-six of forty elements rated in the strong band (≥8/10); only one rated in the weak band — Social Responsibility, definitionally outside scope for a PE value-creation product. The full scoring is below, so you can judge it yourself.

Elements Evaluated
40
Bain B2B Elements of Value
Average Score
7.6 / 10
Premium consulting profile
Strong Band ≥8
26 / 40
65% of elements
Weak Band <4
1 / 40
3% — out-of-scope element
SEAS Bain B2B Elements of Value executive summary — 7.6 of 10 average across forty elements, with 26 elements in the strong band. Pyramid shows tier averages: Table Stakes 8.3, Functional 7.8, Ease of Doing Business 7.7, Individual 7.7, Inspirational 5.8.
Download full 40-element dashboard
Framework: Bain & Company, The B2B Elements of Value (Harvard Business Review, 2018). Scoring: SEAS author assessment, 2026.

You can inspect it before you buy.

A $2,997 download you can't see into is a leap of faith — so here is the actual system. Every agent, the model that prices the upside, the software that runs the diagnosis, and the architecture that ties it all together. What stays behind the paywall is the operational substance: the production prompts, the live formulas, and the copy-and-run playbook. Everything that proves it's real is on this page.

The roster

All 35 agents, named

Nine fund- and portfolio-level agents that work across any company, plus 26 sector agents purpose-built for 13 industries. Knowing one exists tells you what it does — it does not let you rebuild it.

35
Agent blueprints
9
Fund & cross-functional
26
Industry-specific
13
Verticals covered
Fund & cross-functional  — works across every portfolio company (9)
Capital Structure Agent
Watches covenant headroom four quarters out, simulates 20+ leverage scenarios, and flags breaches before they hit.
Tax Arbitrage Agent
Calculates effective tax rate by entity and jurisdiction, then ranks restructuring scenarios by after-cost NPV.
Contract Value Capture Agent
Mines the contract repository for unbilled clauses, escalators, and renewals — and acts before value leaks.
Synthetic Operating Partner
An always-on operating partner across the portfolio, surfacing the highest-yield intervention per company.
Macro Scenario Desk Agent
Models rate, FX, and demand scenarios against the book and stress-tests each value-creation plan.
Deal Structuring Agent
Structures and pressure-tests new deals — sources, terms, and returns — before the acquisition closes.
Fund Economics Optimizer
Optimizes fund-level economics: fee structure, waterfall, and the pace of capital deployment.
LP Narrative Agent
Builds the data-backed LP story and accelerates fundraising velocity for the next raise.
Ecosystem Builder Agent
Finds platform and cross-portfolio synergies that compound value over an 18–36 month horizon.
Industry-specific  — two per vertical, tuned to that sector's leakage (26)
Manufacturing & Industrial
Production Yield Optimization · Predictive Quality Control
Healthcare Services
Revenue Cycle Optimization · Clinical Workforce Scheduling
Business & Professional Svcs
Utilisation & Billing Optimization · Client Retention & Expansion
Financial Services (Non-Bank)
Loan Underwriting Acceleration · Regulatory Compliance Monitoring
Technology & SaaS
Net Revenue Retention Optimization · Cloud / FinOps Cost Optimization
Retail & Consumer
Dynamic Pricing & Markdown · Inventory Allocation & Replenishment
Food & Beverage
Food Cost & Waste Optimization · Demand Forecasting & Labour
Logistics & Transportation
Route & Load Optimization · Fleet Predictive Maintenance
Construction & Engineering
Project Cost & Schedule Overrun · Subcontractor Performance & Risk
Insurance
Claims Leakage Detection · Underwriting Risk Calibration
Real Estate & Property
Tenant Revenue Optimization · Maintenance & CAPEX Timing
Education & Training
Enrollment Yield & Retention · Instructor Utilisation & Program Cost
Hospitality & Hotels
Revenue Management (RevPAR) · Guest Experience & Ancillary Revenue
Agent anatomy

What's actually inside one agent

Every one of the 35 ships with the same backbone — function, data inputs, decision logic, output, KPI, and guardrails. Two real examples below, fully structured. The one thing redacted is the production system prompt itself — that lives in the Agent Prompts Library, because the prompt is the product.

Capital Structure Agent
Fund · cross-functional
Continuously watches leverage against every covenant in the credit agreement, models how the next four quarters could play out, and recommends action while there is still room to act.
Data inputs
Internal financials — EBITDA forecast, leverage, cash position · External market data — rates, comparables · Covenant terms parsed directly from credit agreements
Decision logic
Ingest latest EBITDA forecast → compute covenant headroom for the next 4 quarters → simulate 20+ scenarios (base / upside / downside) → flag any breach within 6 months → recommend refinance, paydown, or capital reallocation, ranked by NPV.
Output & KPI
Covenant early-warning + ranked capital actions. Tracked on: quarters of headroom, breaches avoided, refinancing NPV captured.
Guardrails
Read-only access to source financials · recommendations require human sign-off · credit-agreement & OECD compliance checks.
Production system prompt — in the Agent Prompts Library
Claims Intelligence & Recovery Agent
Healthcare · rev cycle
Specified to review claims against payer-specific rule sets before submission (a mature deployment typically encodes 1,200+ rules), flag coding and authorization gaps, and generate corrected resubmissions for denials on a 24-hour cycle — build targets defined in the spec.
Data inputs
Encounter records — CPT / ICD-10 / HCPCS, payer contracts, prior-auth status, denial history, AR ageing · External — payer / LCD / NCD updates, HFMA & MGMA benchmarks · Coding intelligence — code-to-denial matrix, undercoding model, appeal success rates
Decision logic
Pre-submission scan against payer rules → flag missing modifiers, auth gaps, code–diagnosis mismatches → auto-correct and resubmit denials within 24h → route complex cases to specialists with pre-built appeal packages.
Output & KPI
Higher clean-claim rate, lower rework time, recovered net revenue. Context: providers lose 4–7% of net revenue to denial leakage.
Guardrails
Clinician review for any coding change · no PHI leaves the environment · full audit trail.
Production system prompt — in the Agent Prompts Library
The economics

The numbers, at the headline

The suite ships live, formula-driven Excel models — ROI, MOIC, EBITDA bridge, implementation budget. Here is the ROI summary they produce for the reference $150M company. The outputs are shown; the working formulas stay in the files.

Strategic agentAnnual impact ($150M co.)Implementation costPayback
Capital Structure$400K–$800K$80K–$150K2–4 mo
Tax Arbitrage$500K–$1.2M$100K–$200K2–5 mo
Contract Value Capture$600K–$1.5M$120K–$250K2–4 mo
Synthetic Operating Partner$800K–$2.0M$200K–$400K3–6 mo
Macro Scenario Desk$300K–$900K$100K–$180K3–7 mo
Deal Structuring (per deal)$1.0M–$3.0M$150K–$300Ksingle deal
Portfolio agents 1–6, combined annual$3.6M–$9.4Mdeal-structuring impact non-recurring, excluded
In the workbook these are not typed numbers — every figure is a live formula (e.g. =Recovered/Revenue). Shown here as output only; the working models ship inside the suite. Implementation cost ranges model a consultant- or vendor-led build; buyers implementing in-house with the included specifications substitute internal team time and tooling for most of that line — that substitution is the product's economic case.
$18M
Entry EBITDA
+$5.3M
Annual recovery (modeled)
+3.6 pts
Margin 12% → 15.6%
10×–11×
Exit re-rating scenarios (modeled)
2.10×
Modeled MOIC vs 1.48× baseline @ 9.5× re-rated exit
Architecture

How the 35 agents fit together

Three layers, deployed through a six-phase rollout that cannot scale past a gate it has not cleared — all sitting on a documented governance stack.

Layer 1 — Fund level
Fund Economics Optimizer Deal Structuring Macro Scenario Desk LP Narrative Ecosystem Builder
Layer 2 — Portfolio, cross-functional
Capital Structure Tax Arbitrage Contract Value Capture Synthetic Operating Partner
Layer 3 — Industry verticals · 26 agents across 13 sectors
ManufacturingHealthcareProf. ServicesFinancial SvcsTech / SaaSRetailFood & BevLogisticsConstructionInsuranceReal EstateEducationHospitality
Deployment — six phases, gate-controlled
0 · Foundation
1 · Pilot
▸ Gate ◂
2 · Production
3 · Expansion
4 · Optimize
5 · Scale
Governance stack  —  NIST AI RMF · ISO 42001 · SOC 2 · SOX · GDPR · CCPA / CPRA · HIPAA · PCI DSS
The software

EBITDA PathFinder Pro v3.0 — the diagnostic engine, module by module

The playbooks tell your team what to do. The software tells you where — on your own numbers. Enter your P&L, balance sheet, and retention data and it returns costed, risk-weighted optimization paths in minutes. It ships as a single file that runs in any browser on Macintosh, PC, or any operating system — no install, no login, no server, and it works fully offline. Your financials never leave your machine.

7
Interactive modules
11
Costed optimization path types
8
Industry benchmark libraries
0
Network calls — data stays local
The seven modules  — from raw financials to a defensible value-creation case
1 · Financial Input
Income statement, balance sheet, and retention inputs across 8 industries. One click loads a fully worked sample company.
2 · Dashboard
Current-state KPIs plus an EBITDA waterfall — from where you are today to the risk-adjusted potential, path by path.
3 · Optimization Paths
Up to 11 paths for your inputs — each priced with dollar impact, implementation cost, payback period, timeline, and a realizability score.
4 · Scenario Builder
Toggle paths on and off; the diminishing-returns engine recomputes theoretical, risk-adjusted, and bankable uplift live.
5 · Benchmarks
Your seven core metrics — margins, cost ratios, revenue per employee, cash conversion, retention — against low / median / high industry ranges.
6 · Action Tracker
Every path unpacks into a checkable execution list, so the diagnosis converts directly into a work plan.
7 · PE Value Creation
MOIC and IRR from your own entry and exit multiples, leverage, hold period, debt paydown, and organic growth assumptions.
Built to understate, not to impress  — every headline number is confidence-weighted. Each path carries a realizability score of 40–80%, the aggregation engine applies diminishing returns as paths stack, and the "bankable" figure it reports is deliberately the most conservative of the three totals it computes. Results export to CSV for your board pack. The module map is on this page; the software itself is in the download.

Vet it like a deal.

One company, start to finish — the reference model the playbook works through end to end — followed by the documents you can open and read right now. No form, no email.

The company01

A $150M-revenue mid-market company, $18M EBITDA, 12% margin. Acquired at 8.0× for a three-year hold. This is the representative company the entire playbook is modeled against.

$150M
Revenue
$18M
EBITDA
12%
Margin
8.0×
Entry multiple
The diagnosis02

A 90-minute diagnostic mapped the leakage to three pockets. Of roughly $12M identified, ~$5.3M was assessed as recoverable annually — the conservative, not the headline, figure.

$2.5M
Supply chain & vendor
$1.8M
Administrative / SG&A
$1.0M
Energy & operations
The agents deployed03

Contract Value Capture went after unbilled clauses and escalators. Capital Structure freed covenant headroom and refinancing NPV. Tax Arbitrage re-rated the effective tax rate. Sector agents took the operational pockets — supply-chain and energy.

Each ran read-only first, recommending; humans approved before anything touched a system of record.

The gate04

Nothing scaled on faith. At roughly week 8, the Phase-1 pilot had to clear all five thresholds before expansion was funded. Miss one, and the rollout pauses rather than spreads.

>90%
Accuracy
>25%
Cycle-time cut
>15%
Cost cut
<8%
Exception rate
>3.5/5
User satisfaction
The result05

Recovery modeled at +$5.3M annual EBITDA, lifting margin from 12% to ~15.6% across the 12–18-month deployment. The verified MOIC model underwrites only the bankable 9–15% subset of baseline EBITDA — not the full $5.3M — and takes the deal from a 1.48× baseline to a modeled 2.10× at a 9.5× exit, and 2.55× in full execution at 10.5×; the re-rating (10×–11× scenarios) lifts the EV bridge by +$96M to +$120M — modeled as scenarios, not the base case.

+$5.3M
Annual EBITDA (modeled)
15.6%
Margin (from 12%)
10×–11×
Exit re-rating scenarios
2.10×
Modeled MOIC (vs 1.48×)

Reference model used throughout the playbook. Figures are modeled ranges for a representative $150M company — illustrative of the method, not a guarantee of results.

The documents, open

Read the source material yourself

Three documents from the suite, available directly — orientation, positioning, and the sample inputs the models actually run on.

Read Me First
What's in the suite, how it's organized, and how it's meant to be deployed — the full orientation document.
PDF · Overview
View PDF
Comparative Analysis
How SEAS stacks up against consultants, point tools, and building it yourself — including the honest trade-offs.
PDF · Positioning
View PDF
Sample Data & Worked Diagnostic
The sample datasets the models run on, with the guide that walks the diagnostic — see the inputs for yourself.
PDF · Sample inputs
View PDF

These are the orientation, positioning, and sample-input documents — open, no email required. The 35 full agent specifications, the production prompts, the live Excel models, and the 309-page playbook are the paid suite.

Run Your Diligence

Don't trust us.
Verify everything.

There is no sales team behind this page. No discovery call, no webinar, no follow-up sequence pressuring you to decide. That is a deliberate constraint — it means the product has to survive your scrutiny on its own. Here is what you can check before spending a dollar.

[ 01 ]

The numbers are counted, not rounded

1,711 verified Excel formulas across 9 workbooks. 309 pages. 35 agents — 9 cross-functional + 26 across 13 industry verticals. Odd, unrounded figures — because every one was audited and counted, not estimated for a headline.

[ 02 ]

Reviewed by named professionals — with their real names attached

The framework was independently reviewed by Abhishek Behera (Senior Tech Lead, Thomson Reuters) and Garvit Bhada (former private equity analyst, REA Group / Housing.com, now in US financial services). Both gave written consent to be named here.

These are peer reviews of the methodology — not customer testimonials. We label them exactly as what they are.

[ 03 ]

Your refund isn't in our hands

SEAS carries a 90-day money-back guarantee, and payment is processed by Polar as merchant of record. A refund request goes through their system — we can't stall it, renegotiate it, or make you sit through a retention call.

[ 04 ]

One price, one download, no lock-in

SEAS is a one-time download. No subscription that quietly renews, no "book a call for pricing," no upsell required to make the core product work. You pay once, you keep the files, and 90 days of email support is included.

Do not buy this if

  • Your firm is under $50M in revenue — the leakage math won't justify the effort yet.
  • You want done-for-you consulting. This is a self-execution system, not an engagement.
  • You expect live calls or implementation support beyond email. There are none, by design.
  • You need board-ready results without assigning an internal owner to run the 90-day plan.

Still skeptical? Good — that's the right instinct. The cheapest way to test whether we're right about your P&L is the $47 automated diagnostic. It scores your firm's EBITDA leakage in minutes, and if the output isn't useful, you'll know before ever considering the full system.

Run the $47 diagnostic →

The reference model above is illustrative. This one isn't.

We pointed the SEAS diagnostic at a real, publicly traded mid-market manufacturer of protective clothing and safety apparel, using nothing but its public financial filings. The company is deliberately anonymized — it never asked to be analyzed, and we won't characterize a named business to make a point. Every figure below is a benchmark-based estimate of opportunity — the hypotheses SEAS puts on the table on day one — not a finding of waste. It is the most honest version of a worked case, and the more credible one.

$6–10M
Annual EBITDA opportunity surface
$3–6M
Incremental, net of management guidance
$49–83M
Implied EV at 8.0×
100% public
Built from filings · identity withheld

The lens sized three pockets against best-in-class peer benchmarks: SG&A integration efficiency after a run of acquisitions, pricing harmonization across newly acquired brands, and procurement consolidation — plus a separate one-time working-capital release of $10–18M. Crucially, the analysis is netted against the company's own forward guidance, so it never double-counts the recovery management already expects. That reconciliation — a gross surface of $6–10M against a genuinely incremental subset of $3–6M — is what separates a credible diagnostic from a sales pitch. The document shows every assumption, every source, and every limit. It is what SEAS surfaces from the public record alone, before it has seen a single internal number.

Download the full worked case (PDF)
Independent analysis by Smart Agentic Systems using public financial disclosures. Subject company and peer benchmark intentionally unnamed. Figures are benchmark-derived estimates of potential, not findings of inefficiency, and not investment advice.

You've seen inside. Now the math.

The agents, the models, the architecture, a worked example, an independent review — it's all on this page. There is nothing left to take on faith. What remains is a straightforward decision, and the numbers make it for you.

$2,997
One-time, today. No subscription, no recurring fee.
$5.3M
Modeled annual recoverable EBITDA the system is built to surface.
$100K–$500K
What a consulting engagement costs to produce the same system.

The agentic-AI edge compounds for whoever deploys it first. Every quarter you wait is margin a competitor banks instead of you — and the entry advantage narrows as the rest of the market catches up. The cost of acting is $2,997. The cost of waiting is measured in turns of MOIC.

Everything downloads at once

309-page SEAS playbook — the core operating system
RAPID SEAS Playbook — the daily execution manual with the 12-Week Toolkit
35 build-ready AI agent specifications — 9 fund & cross-functional, 26 industry, across 13 sectors
Strategic Agents Library — full specifications for every agent
Agent Prompts Library — the production system prompts
Templates Library — ready-to-run operational templates
9 live Excel workbooks — ROI, MOIC, EBITDA, budget, vendor matrix, Gantt, data-fitness
EBITDA PathFinder Pro v3.0 — 7-module diagnostic software: benchmarks, costed optimization paths, scenario builder, MOIC/IRR modeling
Project Manager's Runbook — phase-by-phase deployment
Board & fund-level decks — board- and LP-ready
Governance appendices — NIST AI RMF, ISO 42001, SOC 2, SOX, GDPR, HIPAA & more
Sample datasets & worked diagnostic
Comparative analysis & full orientation docs
Commissioned from a consultancy or rebuilt in-house, this is comfortably six figures and many months of work. As one instant download: $2,997.

90-day, no-questions-asked guarantee

Download the entire system and put it to work through the full 90-day deployment window. If it doesn't show you where your EBITDA is leaking, one email gets you a full refund — no forms, no friction. The risk sits entirely with us. The only way to lose is to never look.

The 90-90-90 Commitment

90-day deployment timeline. 90-day 100% refund guarantee. 90 days of email support. You're covered for the entire run. Every support email gets a reply within two business days.

90 days of direct email support — from the author

When you buy SEAS, your purchase includes limited post-purchase email support for 90 days. The complete system is yours to keep the moment you buy — and during those 90 days, the practitioner who built SEAS is reachable by email for questions on putting it to work: how to apply a model to your actual numbers, how to adapt a workbook to your company's structure, or how to sequence the rollout in your organization. Real guidance, in writing, on your schedule — no calls to book, no support queue, no bot — with replies within two business days. You're never left alone with the framework.

Please note: Support is limited to questions about applying the SEAS materials — not done-for-you work, custom analysis, or review of your data. It is general product guidance, not professional, financial, legal, investment, or management-consulting advice, and creates no advisory, consulting, or client relationship. This limited support is not equivalent to, and no substitute for, a full consultancy engagement or a qualified professional. Stated response times are targets, not guarantees; support is provided on a reasonable-efforts basis, and the 90-day period, scope, and availability may be limited or change. All decisions, implementation, and results remain your responsibility. Please do not send confidential or regulated data by email. Full Terms apply.

One license. Everything included. Zero ongoing fees.

No subscription. No per-seat license. No consulting retainer. Pay once and your whole team deploys immediately — with portfolio licensing available for firms rolling SEAS out across multiple companies.

A Note on Pricing 100% refund within 90 days — no questions asked. (Portfolio licences: see Terms.) (Portfolio licences: see Terms.) SEAS is $2,997, one-time — a system built to do in-house what six-figure consulting engagements deliver. Commissioned from a consultancy or rebuilt internally, the equivalent is comfortably six figures and months of work. Deploying across a portfolio? Private equity firms and institutional buyers can license SEAS at $1,997 per company (minimum three companies) — email [email protected] for portfolio licensing. Students, academics, non-profits, and buyers in emerging markets: email the same address for a region- or role-based code.
Complete Suite
Standard license
$2,997
One-time payment. Instant download via Polar.
the system a $100K–$500K engagement would build — yours to keep
  • SEAS Master Playbook (6-phase architecture)
  • RAPID SEAS Playbook (daily execution manual)
  • 35-Agent Prompt Library (9 cross-functional + 26 industry-specific)
  • Working Financial Model (Excel)
  • EBITDA PathFinder Pro v3.0 diagnostic software — runs on Macintosh & PC, any operating system, fully offline
  • Complete Templates Library (IC Memo, LP Update, CEO Briefing, AI Scorecard)
  • Project Manager's Runbook with 29-milestone Gantt
  • 90-Day Pilot Playbook + Agent Deployment Tracker
  • Governance Deep-Dive (NIST, SOX, GDPR, CCPA, EU AI Act)
  • FLOAT Diagnostic System
  • ERP Data Export Guide + Vendor Landscape Matrix
  • 90 days of direct email support from the author
Get Instant Access →
By clicking Get Instant Access you agree to our Terms & Conditions.
Includes 90 days of direct email support from the framework's author. Questions before you buy? [email protected]
Secure checkout via Polar · Instant digital delivery · No calls
100% refund within 90 days — no questions asked. (Portfolio licences: see Terms.)
Before you decide — see if SEAS is right for you →

A one-off roadmap is a report. SEAS is the engine.

A done-for-you AI advisory will build a custom EBITDA roadmap for a single portfolio company — typically $10,000–$20,000 per company, delivered in a couple of weeks, and you don’t keep the underlying system. SEAS hands you the system itself to own and reuse — deploy it in your company, and license it across a portfolio at a fraction of per-company consulting cost.

Done-for-you roadmap
$10K–$20K per company
  • One custom report for one company
  • Delivered in roughly two weeks
  • Pay again for the next company
  • You don’t keep the framework or the agents
  • Implementation billed separately
SEAS
$2,997 once
  • The complete system — 35 agents, models, full playbook
  • Instant download, deploy the same day
  • Deploy across your whole organization
  • One payment for your organization — yours to keep
  • Implementation tools included

Built by one practitioner — named, on the record.

Lalit Kumar is a technologist and management operations strategist with over 20 years of experience driving enterprise transformation and operational turnarounds. His personal independent research focuses on identifying and executing high-impact EBITDA levers across pricing, cost structures, and operational efficiency at the intersection of technology strategy, cybersecurity, financial performance, and value creation.

He has led initiatives spanning product development, IT transformation, and performance optimization, consistently aligning technology execution with quantifiable outcomes, cybersecurity posture, and exit-ready documentation.

His recent research also includes structured analysis of PE-backed and mid-market firms adopting agentic AI-driven operational models between 2023 and 2025, with a focus on practical EBITDA impact, multiple expansion, and diligence-grade implementation rather than theoretical capability — grounded in academic foundations spanning computer science and mathematics (B.Sc.), applied computing (MCA), and law (LL.B.), a combination that informs his emphasis on diligence-grade documentation, regulatory alignment, and technically grounded implementation.

Connect on LinkedIn →

Why This Book Exists

This Strategic EBITDA Acceleration System — The SEAS Playbook has been developed to remove/reduce the consultancy cost of $100K–$500K for mid-market firms in implementing agentic AI. It provides frameworks comparable to what top consulting firms deliver, at a fraction of the cost. If a $150M revenue firm follows the "FLOAT" 7-day stress test and identifies up to $5.3M+ in EBITDA leakages, the $2,997 price is just a "rounding error" and the projected ROI is 3–8x for Year 1 alone with implementation costs included.

Questions buyers ask first.

Who is SEAS built for?
SEAS serves two primary audiences — mid-market companies ($50M–$500M revenue) and the PE firms that back portfolio companies in that range — plus the consultants, fractional CFOs and COOs, and advisors who serve them. If you're accountable for EBITDA, or responsible for making AI work in a mid-market operating context, SEAS is for you.
Do I need a technical background to deploy this?
No. SEAS is designed for operating executives and advisors, not engineers. The agent library uses plain-language prompts. The runbooks assume standard business tools (ERP, CRM, Excel). No coding required.
How is this different from hiring a consultant?
A consulting engagement costs $100K–$500K, takes 3–9 months, requires significant internal bandwidth, and ends when the project ends. SEAS costs $2,997, deploys in weeks, requires no internal project management overhead, and remains in your toolkit permanently. Many consultants buy SEAS to deploy with their own clients.
What if we're already using AI tools?
SEAS complements existing AI adoption. The FLOAT Diagnostic identifies whether your current tools are generating measurable EBITDA recovery or just operational activity. Most companies discover significant leakage persists despite prior AI spend.
Is this relevant for my specific industry vertical?
The 35-agent library includes 26 industry-specific agents across 13 verticals, covering the most common mid-market and PE-backed company categories: manufacturing, healthcare services, B2B SaaS, distribution, professional services, and more.
MIT found 95% of enterprise AI pilots deliver no P&L impact. Why would this work?
MIT's finding wasn't about weak models or small budgets — the failures came from a "learning gap": programs run as technology projects, with no financial baseline, no owner accountable for recovered dollars, and no gate tying each phase to a measured result. SEAS is built around the inverse: baseline first, one gated pilot, hard thresholds at week 8, no scaling until the gate clears. A playbook cannot execute for you — your team still does the work — which is exactly why the guarantee covers the full 90-day deployment window.
Am I buying working software or documents?
Documents, models, and prompts — stated plainly. SEAS is a specification-and-playbook layer: 35 complete agent blueprints with their production system prompts, nine live Excel workbooks, the 309-page playbook, templates, and runbooks. Your team (or your AI vendor) connects the agents to your systems using the specs. It is not pre-installed software that runs on day one — and any product at this price claiming otherwise deserves your skepticism.
What does the refund guarantee cover?
90 days, 100%, no questions asked — matched to the full 90-day deployment timeline, so the guarantee never expires before the work is done. One email and the refund is processed through Polar to your original payment method. Upon refund, your license terminates and all copies must be deleted. Full terms at /terms.html.
What's the delivery format?
Instant digital download via Polar. All components are delivered as PDF and Excel files, immediately accessible after purchase. No waiting, no onboarding call, no scheduling required.

The evidence behind agentic AI and EBITDA uplift.

Six analyses of what the research actually shows about turning agentic AI into margin — why most programs fail, where the value is, and how disciplined operators capture it.

Why most agentic-AI initiatives fail to move EBITDA — and what separates the few that do not

The failure rate is now well documented, and the cause is not the technology. Most enterprise AI programs never reach the P&L because they are governed as technology projects rather than financial ones — with no baseline, no owner accountable for recovered dollars, and no stage-gate tying each phase to a measured result.

The evidence is stark. MIT's 2025 study The GenAI Divide, conducted by its Project NANDA initiative across 300 public deployments, 150 leader interviews, and 350 employee surveys, found that 95% of enterprise generative-AI pilots delivered no measurable P&L impact, while only 5% captured significant value. Its central conclusion is the part operators should internalize: the gap is not explained by model quality but by a “learning gap” — the failure to integrate AI into real workflows. Gartner has separately projected that more than 40% of agentic-AI projects will be scrapped by 2027.

The mechanism is consistent. When AI is run as a technology initiative, success is defined as “go-live” — a model shipped, a dashboard built — and the program produces activity that never reaches margin. The minority that succeed invert the sequence: they begin with a financial baseline, ask where margin is actually leaking, attach each agent to a specific metric, and refuse to scale any phase that has not cleared a measured threshold.

That discipline has a name — gating. In the SEAS framework's modeled deployment, a Phase-1 gate at roughly week eight requires defined thresholds — accuracy above 90%, cycle-time reduction above 25%, cost reduction above 15%, exception rate below 8%, and user satisfaction above 3.5/5 — all of which must be met before scope widens. A pilot that cannot clear the gate is paused, not propagated. This is simply the operational expression of MIT's finding: integration and accountability, not algorithms, decide the outcome.

Sources MIT Project NANDA, The GenAI Divide: State of AI in Business (2025); Gartner agentic-AI forecast (2025); BCG, Build for the Future (2025).

See the gated deployment model in SEAS →

How much EBITDA can a mid-market company realistically recover with AI?

The defensible answer is a specific, bankable number — not a vague efficiency claim. In a representative mid-market company, recoverable EBITDA leakage runs to several margin points, concentrated in a small number of process pockets.

Public benchmarks bound the opportunity. APQC's process data shows top-quartile accounts-payable teams operating at roughly $2–3 per invoice while bottom-quartile peers exceed $10 — a four-to-fivefold gap that recurs across back-office processes and represents recoverable cost, not theoretical savings. BCG's 2025 research frames the upside from the other direction: its “future-built” AI leaders carry 1.6 times the EBIT margin of laggards. The recoverable amount, in practice, is the distance between a company's current process performance and that demonstrated frontier.

In the SEAS reference model — a $150M-revenue, $18M-EBITDA company at a 12% margin — that distance totals approximately $5.3M per year, or about 3.6 margin points. It is not evenly spread. It concentrates in supply-chain and vendor spend (~$2.5M recoverable of ~$6M identified), administrative and SG&A processes (~$1.8M of ~$4M), and energy and operational overhead (~$1M of ~$2M).

The rigor is in underwriting only the portion you can tie to a baseline and sustain — the bankable subset — rather than the theoretical maximum. A board underwrites a defended number, not an aspiration. Held, $5.3M of recovered EBITDA at a typical exit multiple compounds: in the modeled case it adds meaningful enterprise value and roughly a full additional turn of MOIC at exit, before any multiple re-rating is counted.

Sources APQC accounts-payable benchmarks; BCG, Build for the Future (2025); SEAS reference model.

Size your own number with the FLOAT Diagnostic →

Where EBITDA leakage actually hides in a mid-market business

Leakage is not random. It concentrates in three structural pockets that standard financial reporting cannot see, because each is distributed across thousands of individually immaterial transactions.

The first pocket is SG&A and administrative process inefficiency — manual, exception-heavy back-office work such as accounts payable, reconciliations, and reporting that quietly inflates cost per transaction. APQC's data shows bottom-quartile AP functions cost four to five times the top quartile for the same task. The second is pricing and contract drift — margin lost to unmanaged discounting, unenforced terms, and renewals that are never repriced. The third is supply-chain and vendor concentration — overspend hidden in single-source dependencies and maverick buying, plus working capital trapped in extended days-sales-outstanding.

Each pocket is invisible on a standard P&L because it is spread across hundreds or thousands of small transactions, none material on its own. Traditional analysis samples; it cannot examine every invoice, contract line, and purchase order. This is precisely the structural advantage of agentic AI: it can interrogate the full transaction population rather than a sample, which is why it surfaces leakage that periodic audits and consulting reviews miss. It also explains why MIT found value accrues to workflow-level integration — the leakage lives in the workflow, not in the headline numbers.

The disciplined first move is therefore not deployment but diagnosis: a structured assessment that scores all three pockets against external benchmarks and produces a baseline before any technology is purchased.

Sources APQC process benchmarks; MIT Project NANDA (2025); SEAS reference model.

Run the three-pocket diagnostic →

Agentic AI vs. RPA — why the distinction decides EBITDA outcomes

RPA and agentic AI are different technologies with different ceilings. RPA automates predefined, rule-based steps; agentic AI reasons, handles exceptions, and operates across systems toward an outcome. For margin work, the difference is decisive.

The distinction is technical, not semantic. RPA executes a fixed workflow — it repeats the same interface actions a human demonstrated — and by definition is not artificial intelligence; it breaks the moment a transaction departs from the rule. Its strength is the predictable portion of a process; its ceiling is the exception. And the exceptions are exactly where cost and leakage concentrate: APQC's benchmarks show even strong AP functions running roughly 9% exception rates and weak ones around 22%, and exceptions are the expensive, manual, error-prone work.

RPA cannot touch that remainder — it automates the cheap majority and leaves the costly minority. Agentic AI is built for it: it reads unstructured documents, makes context-dependent decisions, escalates only genuine exceptions, and improves from feedback. This is the “intelligent automation” layer that pairs reasoning with execution rather than scripting alone.

The implication for deployment is direct. A program built only on RPA plateaus at the easy tasks — consistent with the long-reported difficulty of scaling RPA beyond initial pilots — while an agent-based approach reaches the judgment-heavy work that actually moves margin, under human oversight. The right model is not “AI instead of people,” but agents owning high-volume judgment work while people supervise exceptions and policy.

Sources RPA technical literature; APQC exception-rate benchmarks; SEAS reference model.

See the 35-agent operating model →

How a CFO should sequence an agentic-AI deployment

The sequence that works is phased and gated, and it begins with diagnosis and a financial baseline — never with a broad rollout. It is the stage-gate discipline applied to AI.

The principle is well established. Robert Cooper's stage-gate methodology, proven in new-product development for decades, holds that investment should advance through discrete phases, each ending in a go/no-go decision against predefined criteria. Applied to AI, it directly counters the failure mode MIT identified — it forces every phase to prove a financial result before the next is funded.

A defensible sequence has four moves. Diagnose: quantify where EBITDA is leaking and set a baseline. Pilot: deploy against one or two high-value processes, contained. Gate: validate the pilot against hard metrics before any expansion — in the SEAS model, a Phase-1 gate around week eight requires accuracy above 90%, cycle-time reduction above 25%, cost reduction above 15%, exception rate below 8%, and satisfaction above 3.5/5, all met. Scale: extend to further processes, each behind its own gate.

This is what protects the CFO. A failing pilot is paused, not propagated, so capital is never committed to an unproven approach; and each gate produces a documented, board-defensible track record. It is also why staged deployments succeed where big-bang programs stall — a conclusion BCG and McKinsey reach independently in finding that value comes from disciplined, end-to-end transformation rather than scattered pilots.

Sources R. G. Cooper, Stage-Gate methodology; MIT Project NANDA (2025); BCG and McKinsey AI research (2025).

Get the phase-by-phase runbook →

How to measure and defend AI's EBITDA impact to a board or investment committee

Impact is defensible only when it is expressed as recovered dollars tied to a baseline, underwritten conservatively, and translated into margin points and exit-multiple effect — the language an investment committee actually underwrites.

The problem with most reporting is measurement, not effort. McKinsey's research captures the consequence: 88% of companies use AI in at least one function, but only 39% can point to any EBIT impact, and usually under five percent. The activity is real; the attributable number is missing.

The method is to baseline each target process before deployment — AP cost per invoice, days-sales-outstanding, contract leakage — measure the delta afterward, and count only the sustained portion. “AP cost per invoice fell from X to Y, releasing $Z, validated over four weeks” is defensible; a productivity anecdote is not. Aggregated across the pockets, this is how a modeled ~$5.3M recovery becomes ~3.6 margin points.

Margin expansion is only half the case. BCG's 2025 study finds AI leaders deliver 3.6 times the three-year shareholder return of laggards, and McKinsey finds digital and AI leaders outperform on total shareholder return by two-to-six times across sectors — evidence that the market re-rates operators who demonstrably run on AI. For a private-equity-held company, that combination — recovered EBITDA plus multiple re-rating — is what converts into enterprise value and improved MOIC at exit. The board does not buy technology; it underwrites a number with evidence behind it.

Sources McKinsey State of AI and digital-leaders research (2025); BCG, Build for the Future (2025); SEAS reference model.

See the IC-ready financial model →